Process
Design philosophy
To substantiate our design decisions, we formulated our own Design Philosophy containing the design goals, key performances and a vision about the future residents. Furthermore, this design philosophy includes the vision of how the building will fit in and what it will add to its environment.
Design goals
The given Design goals are separated into two categories: quantitative and qualitative (see Figure 2).
Additional we formulated four more design goals which have priority:
-
Optimise the building for Sunlight and Sound Pollution With the possibilities that come along with the different python scripts, our aim is it to design a building that is optimised on the aspects of sunlight and sound pollution. This is not only important for the functions that will be found in the future building, but also for its environment. Based on the calculations, we e.g. will shape an envelope that blocks the sun for the surrounded buildings minimally.
-
Develop a layout that suits the residents Every target group has its own needs. These needs can not only be translated into the desirable view or avoiding noise disturbance, but it can also be translated into the design of the floor plans and the connections between different spaces. The elderly, for example, are in a different phase of their life than students. Students probably will need a bigger bedroom so they will have enough space to study. Therefore, elderly people will only sleep in their bedroom but will spend more time in their living room, so in this case, a bigger living room is preferred. With these kinds of guidelines, we will create a suitable residence for our residents.
-
Create a pleasant Living Environment We want to see our future residents happy. Happy residents will become happy and friendly neighbours which will lead to a pleasant living environment, an environment that feels like home, and not only a homey residence. We want to provoke this by creating spaces where the residents can interact with each other (like a co-cooking center or a community center). Furthermore, a healthy amount of daylight and greenery will increase the living quality.
-
Add possibilities to the Rotterdamse Maakkwartier The current building contains not only residences, it is also filled with diverse workshop-rooms, studios and small startups. This great and strong principle is very important to the neighbourhood and therefore should be preserved in the new building. Additionally to this, diverse public functions will be added creating a building that will be a cooperative live-work-playassociation, accessible for residents and other citizens.
Future residents
The shortage of residency in today’s society is an important issue that affects a variety of citizens and therefore it has to be addressed. Due to the significance of this problem, the project will offer housing where people of different life stages can live together. Starters, students and people with the need for assisted living will form a residential community which can lead to beautiful interactions. Especially during the current pandemic, we see how much we depend on each other: for example, it is not safe for the elderly to do groceries, so it would be great if neighbours (in our case starters of students) could do some groceries for them. Additionally, the connection between the target groups will be supported by different design decisions, such as the possibilities to cook together or for each other in the co-cooking center, do workshops together or meet each other in the community center.
As already mentioned in the design goals, we want to develop a layout that suits the residents. So for the starters we will realize a wonted apartment including a bathroom, living room (kitchen, dinner room and sitting room in one), a bedroom and an additional room. This additional room can be used for different functions like a washing room, a study room or an extra bedroom for their first child. Since starters are at the beginning of their life (just graduated, getting a job and maybe starting their own family), it is important that there is enough space for the residence to grow in.
For the people in the need of assisted living it is important that they will be able to stay as long as possible in their own houses, before they have to move to a retirement home. To make this happen there will be additional modifications like a wider corridor and kitchen and special devices in the bathroom to make the apartment walker and wheelchair friendly.
There will be two kind of floor plans for the students: a bigger one habitable for four students and a smaller one, a studio. By creating different floor plans, we want to attract different target groups within the ‘student-world’, namely those who want to live in a 'bigger' house with other people, and those who would like to live on their own.

Analysis on the Site
Before we begin the computational design of the new building, it is important to investigate the current state of our site and its environment. Therefore we did research on different aspects that we thought were important to take into account for the new building.
This research started with analysing the building plot: as you can see in Figure 5 the site is devided in a compulsory part and a optional part. To keep the streets intact, we decided to stay within the borders of the comulsory building plot.
Building visualisation
The visualization of the surrounding environment of our site (Figure 6) consists of a scale of architectural styles. This is due to the different building years, which have led to a diverse neighbourhood where different facades are positioned next to each other. The functions of the buildings also play a role in the diverse visualization. The main function is dwelling but there are also businesses and offices situated. Furthermore, our site is in ZOHO, which is the name of the area of the Rotterdamse Maakkwartier. A developing working and living space for and by makers in design, art, culture, media, tech, food architecture and urban planning. All pioneers who want to use their craftsmanship to strengthen themselves and ZOHO. This is reflected in the appearance of the environment. Creative and notable graphs can be found on the walls, which gives the area a coming up and hip neighbourhood feel. Moreover, near the site there is a shared garden and sportsfield for residents to use and where they can meet others.
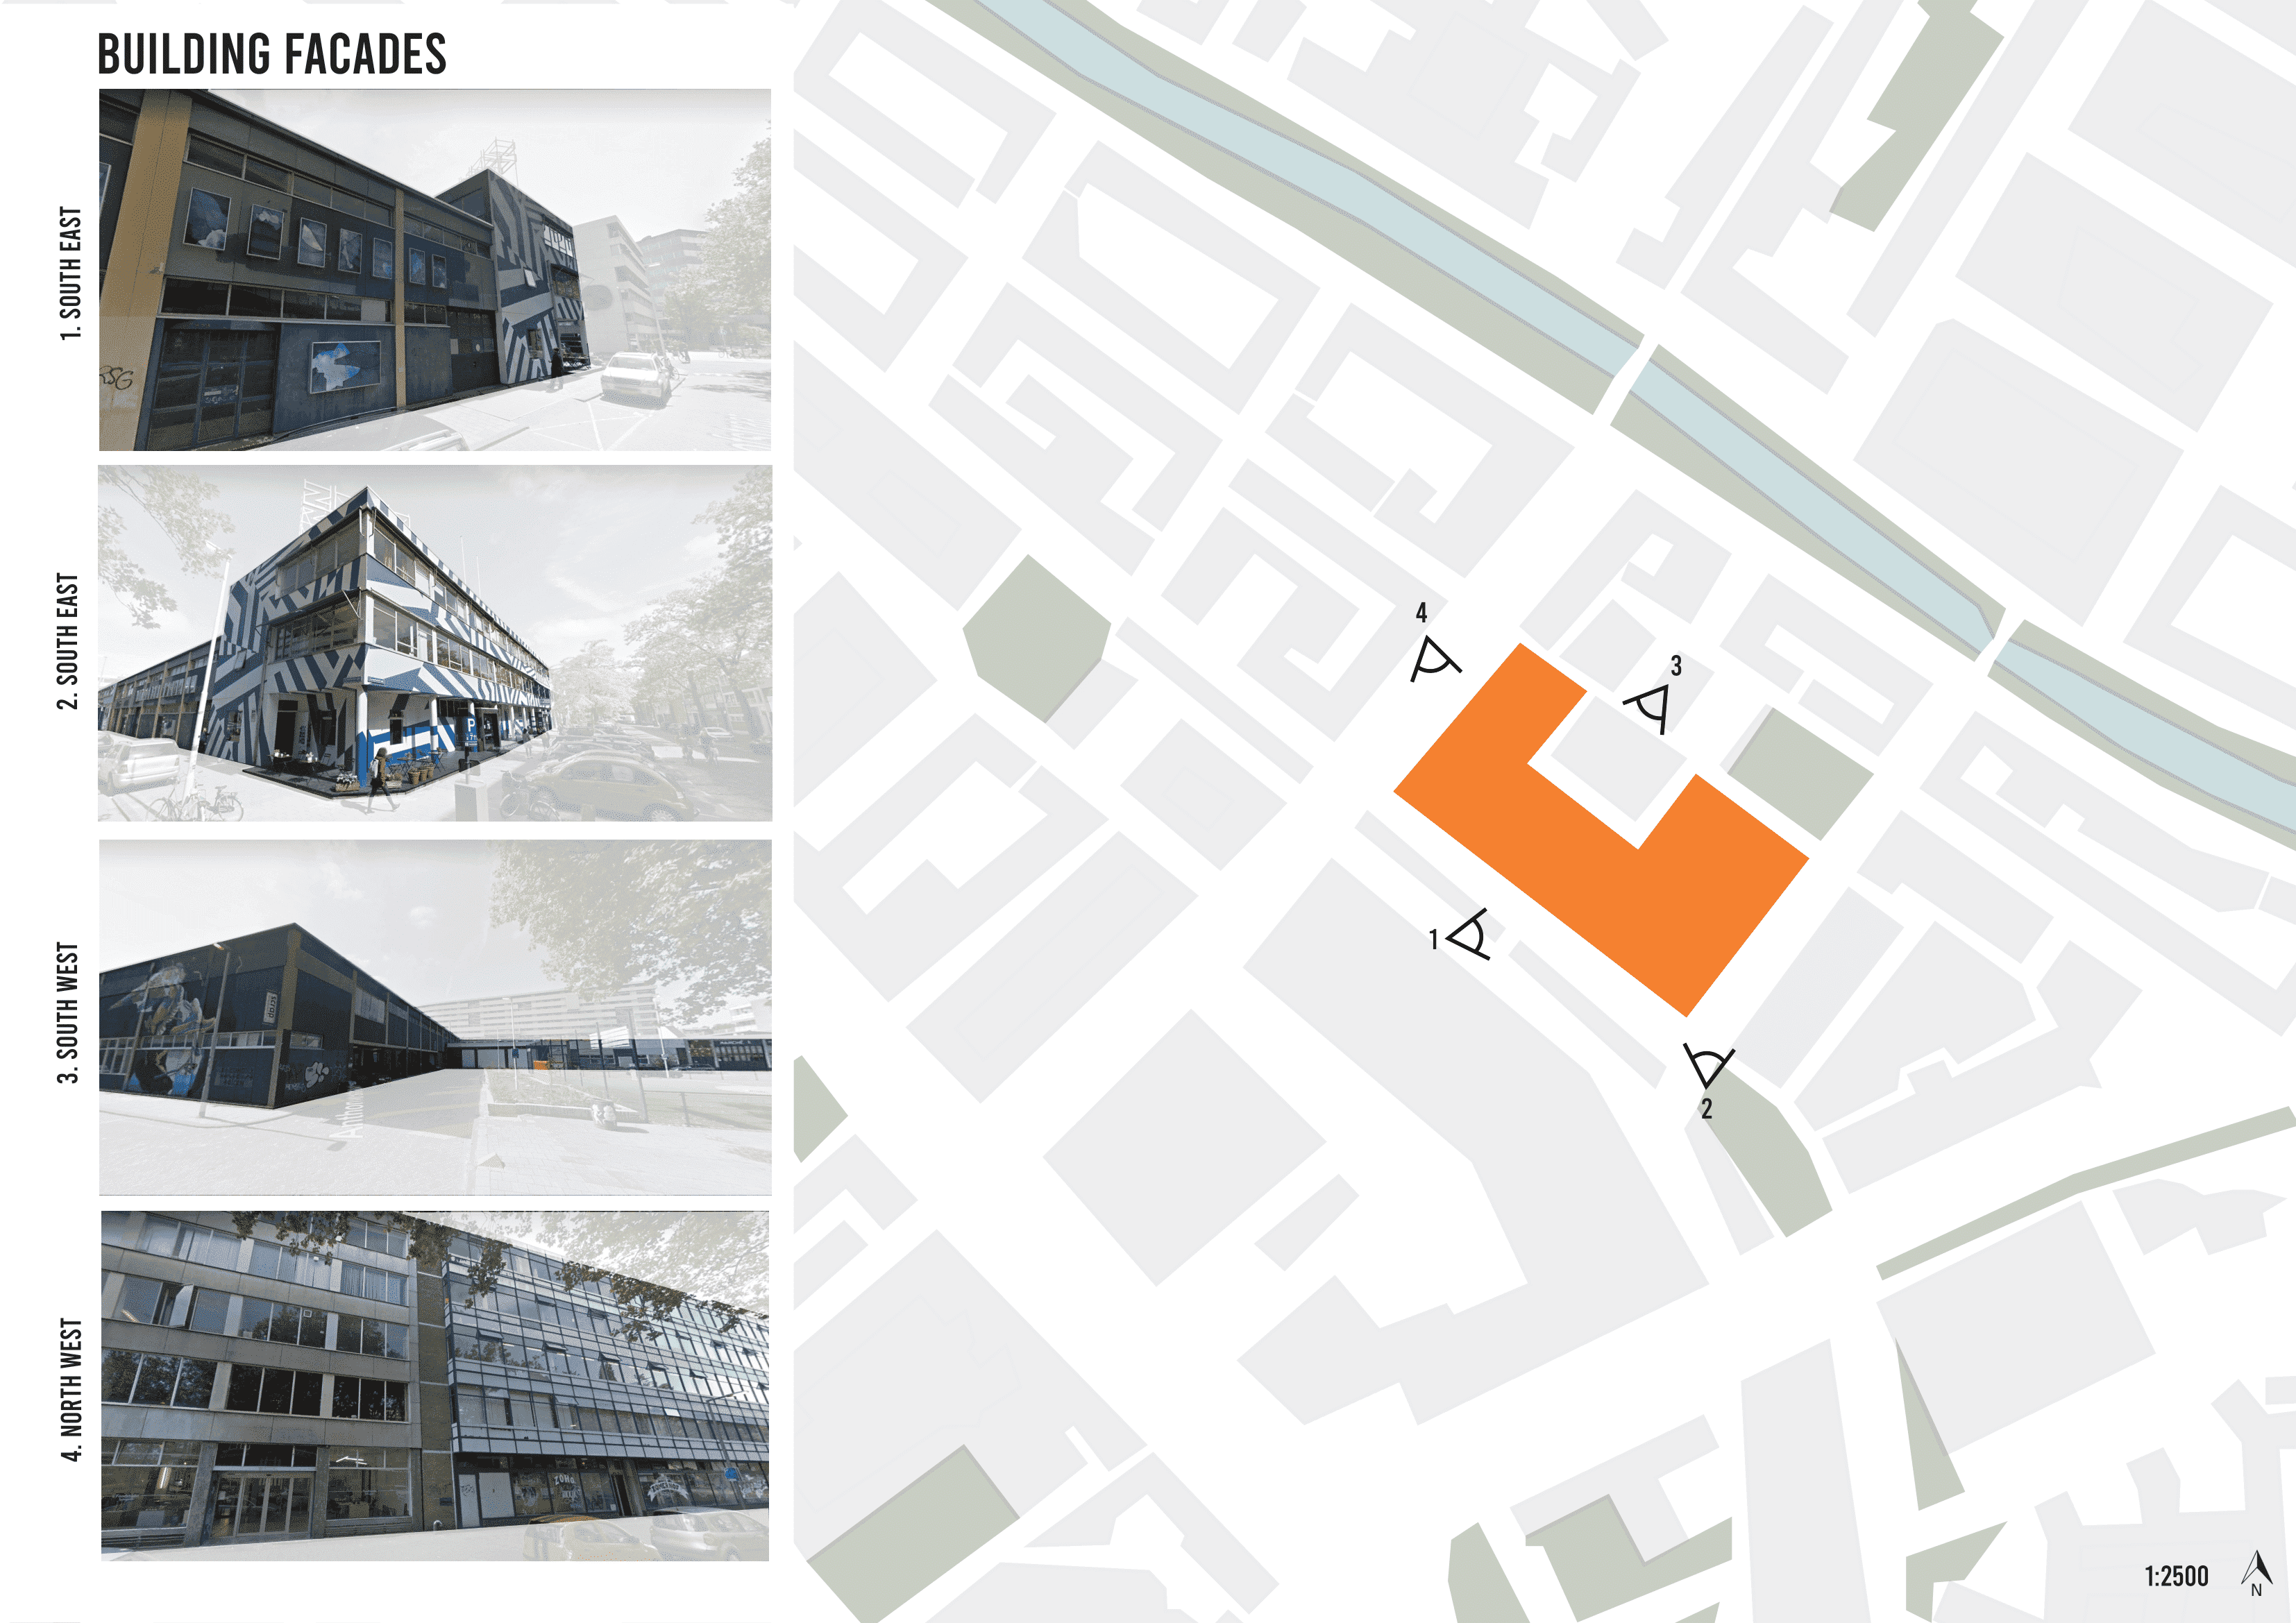
After analyzing the environment it is clear that the current building (Figure 7) blends right in the area. Different kinds of functions that cause multiple identities. The building is a combination of a variation of heights and both monotone and trendy patterned facades.
Access routes
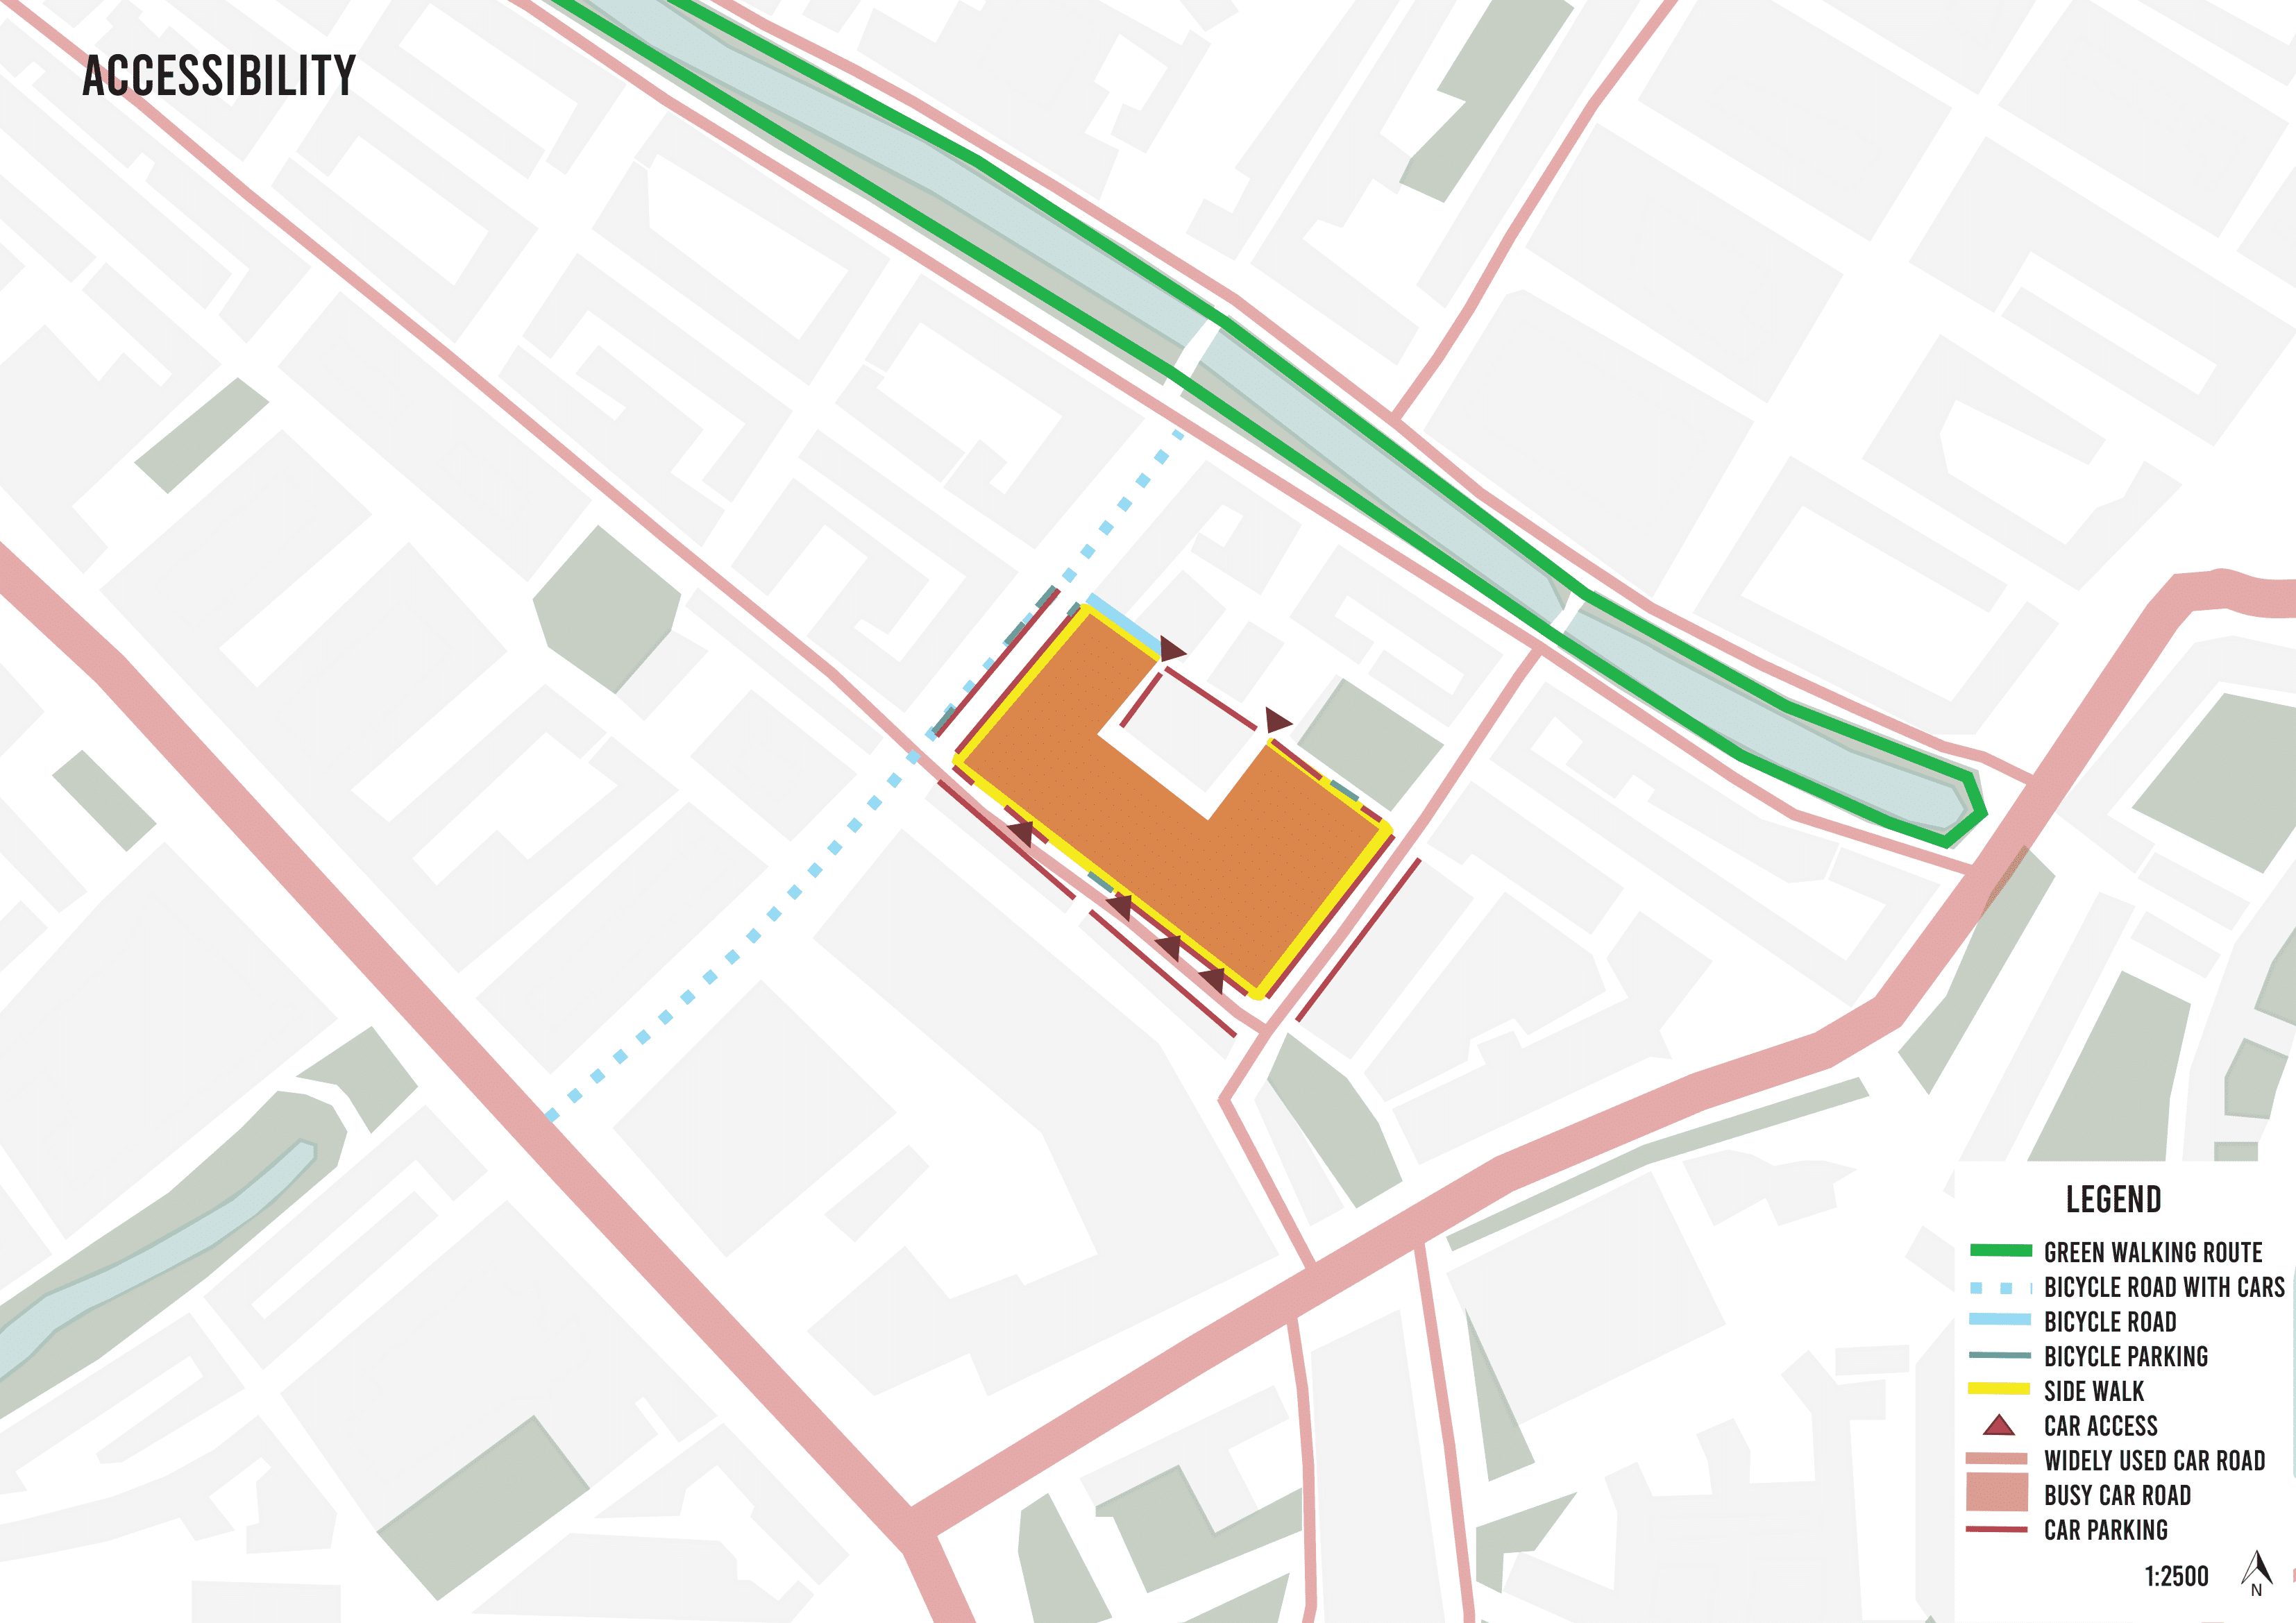
In Figure 8 the accessibility of our site is shown. Our site is directly surrounded by a sidewalk with a few thresholds for access to the parking garage. Only the northeast side of the building is more focused on the accessibility for cars, because of the direct street that is situated opposite the building. Near the building, there are some car parking and a few bicycle parking. Furthermore, the main roads for vehicles that surround our site are bicycle roads (a bicycle road where cars are the guests and cyclists have the priority) and ‘normal’ car roads. Figure 8 visualizes which car roads are busy and which are widely used. In addition to this, the green walking route that is close to our site is shown.
Building heights in the environment
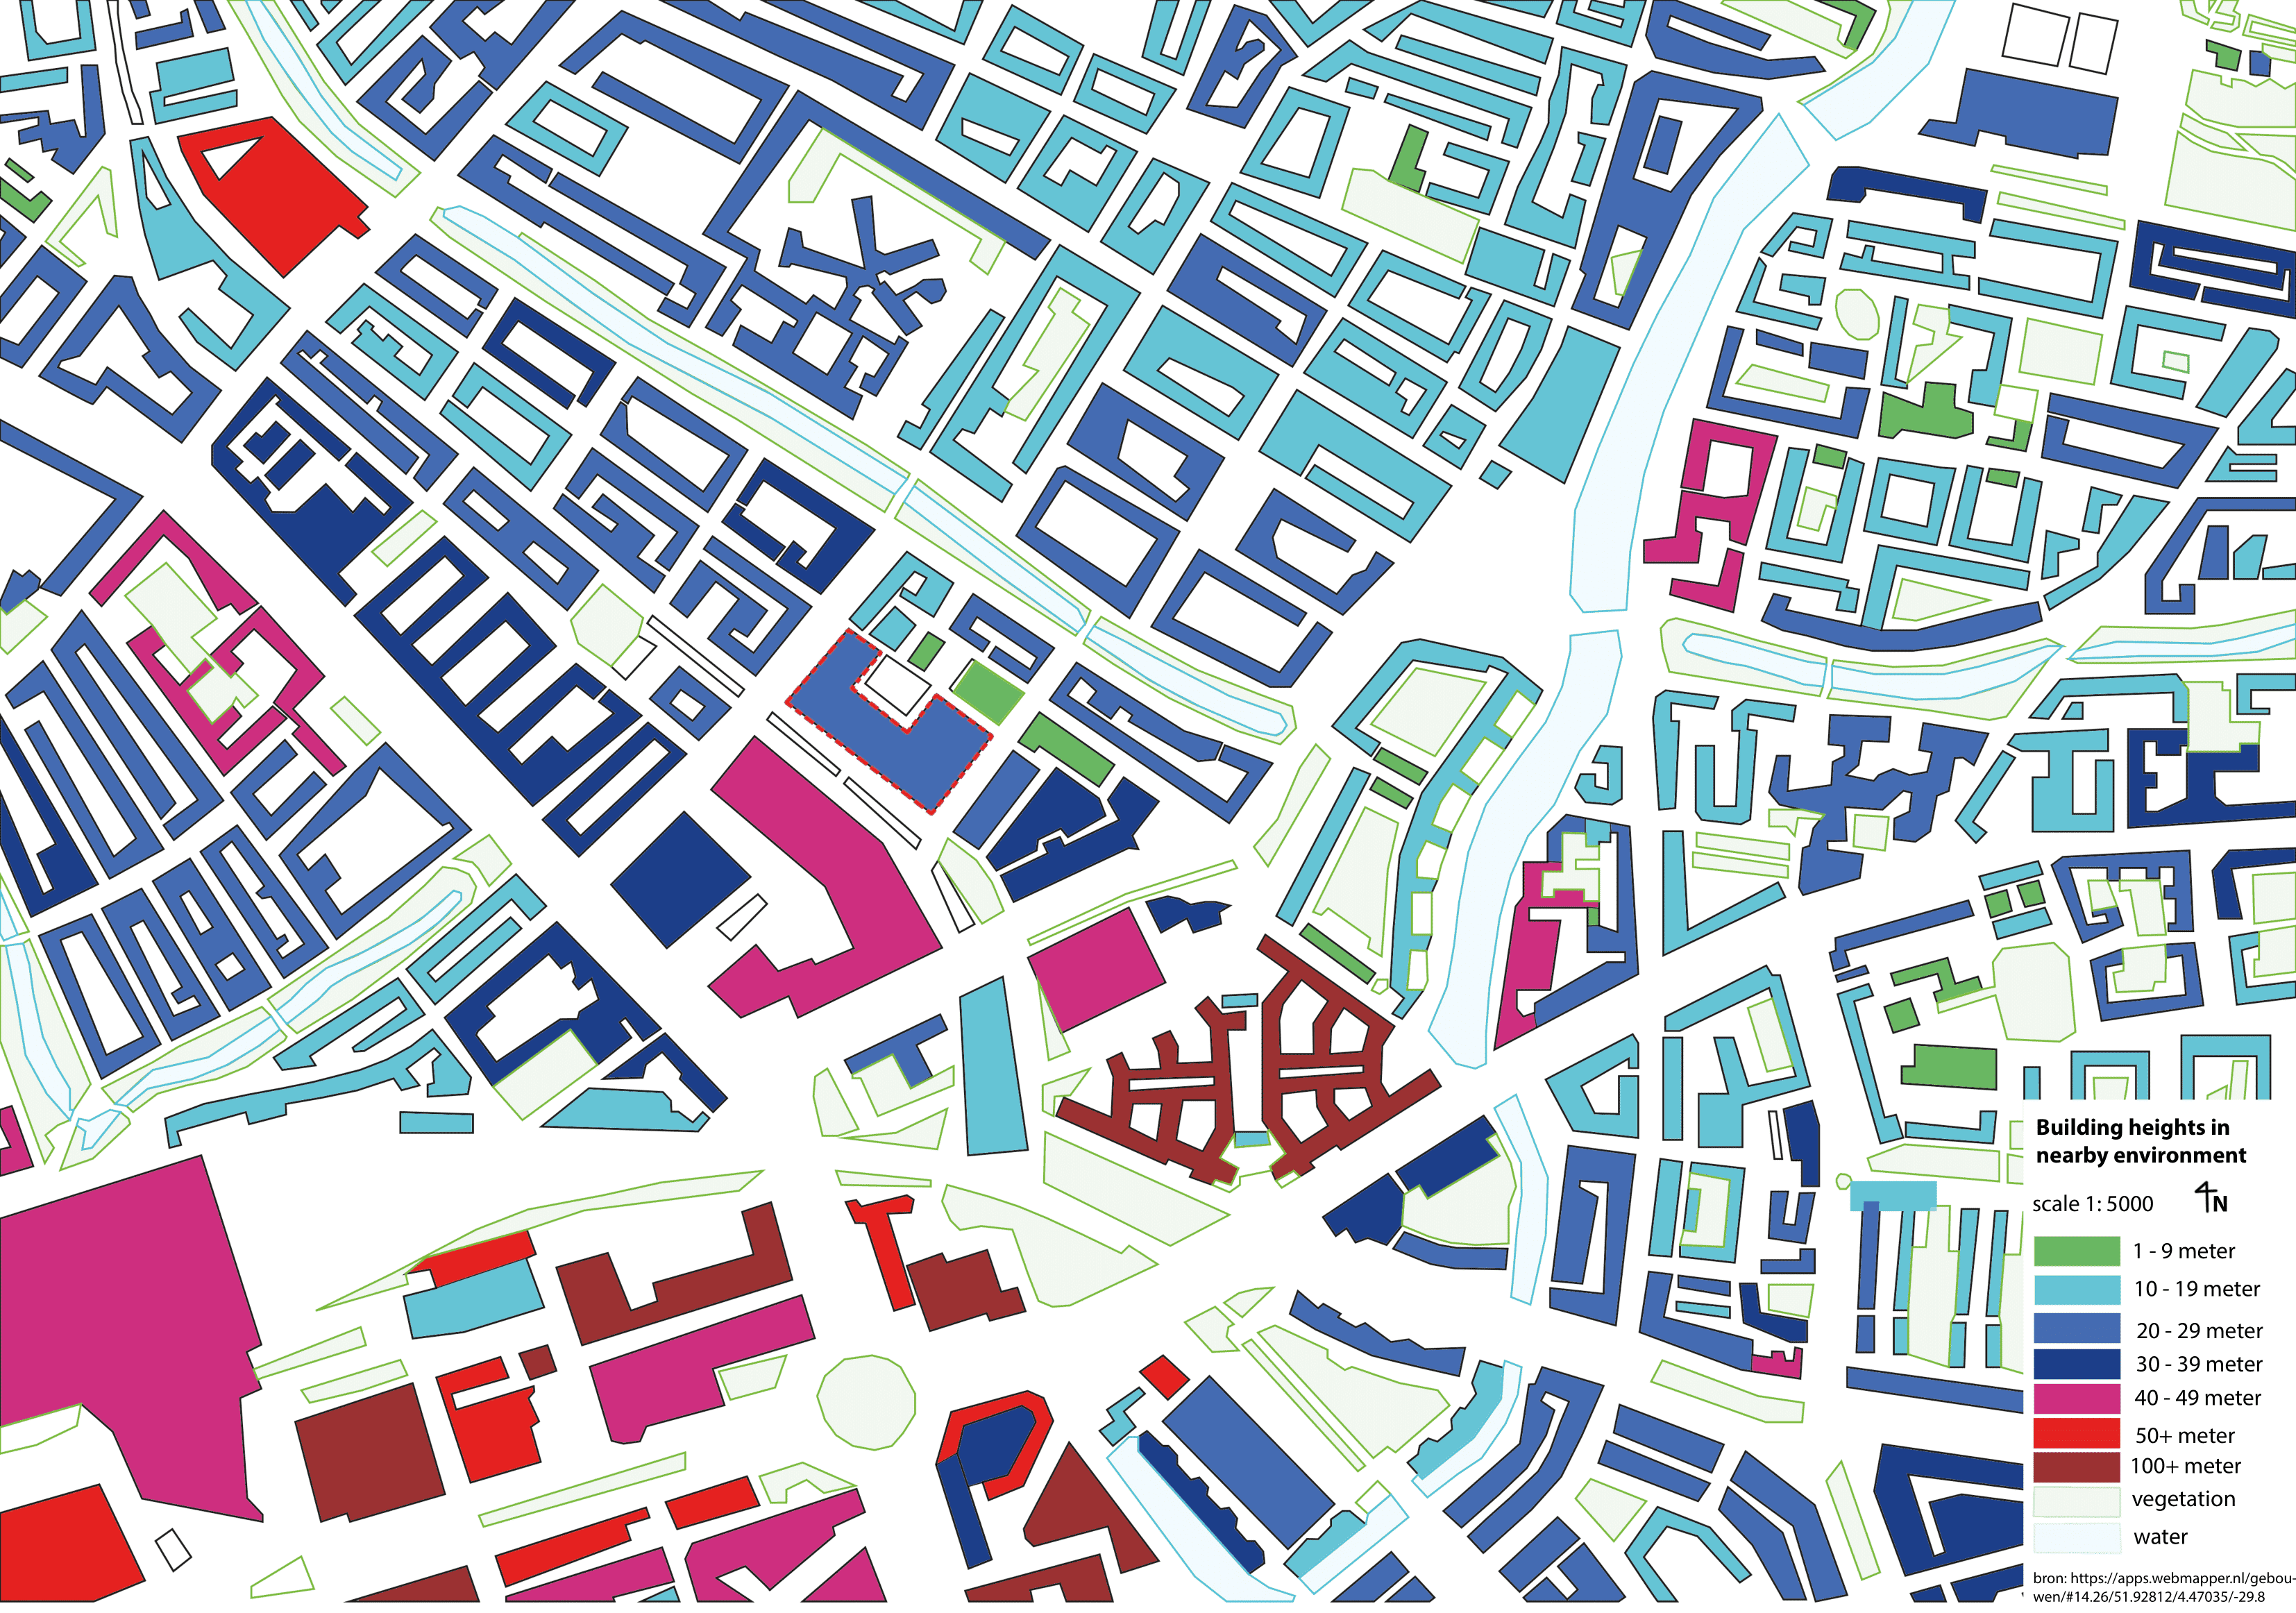
If you look at the built environment, as shown in Figure 9, and start in the north/ northeast, you can see that these buildings are mainly between 18 and 23 meters high. Most of these buildings are terraced houses. If you go around the map clockwise, the buildings are getting higher. Here we still have residents' buildings, but now shaped as duplex houses. At the bottom of the map (south), we are getting closer to the center of Rotterdam. This is why the buildings in the Southwest are higher than the buildings in the north: These are mainly office buildings with a height between 40 meters or even higher than 100 meters. To finish the clock, in the West, same as in the Southeast, we can find duplex houses. Nevertheless, these buildings have more storeys.
With a height of 22 meters, our site currently fits in the street scene very well due to the similar building heights. But if the future building is higher than 40 meters, it will become more of a landmark.
Programme of requirements
Additionally to the Design Philosophy, we formulated a Programme of requirements. This does not only include spatial requirements like the square meter or the ideal storey but also the functional requirements like the number of bathrooms or storage space that is needed. Furthermore it also contains important information about the noise.
Functions size
In Figure 10, a table is shown where aspects concerning the sizes of all the spaces can be found: The floor height, on which storey, square meter, amount of rooms, amount of voxels 3,6 x 3,6 meters (more information about the decision making of the voxel size can be found in Configuring - Process and for how many people the space is designed. This information will be used to construct the building in spatial computing.
Functional requirements
In Functions size we already mentioned the number of square meters and voxels which are needed for each function. Though, it is necessary to subdivide these functions in separate rooms so the voxels can grow in rooms instead of categorised in functions. The table underneath (Figure 11) shows exactly how many square meters will be needed for e.g. the technical room of the arcade, or how big the staff room in the supermarket will be. More information, regarding the amount of voxels fitting into these spaces, can be found here.
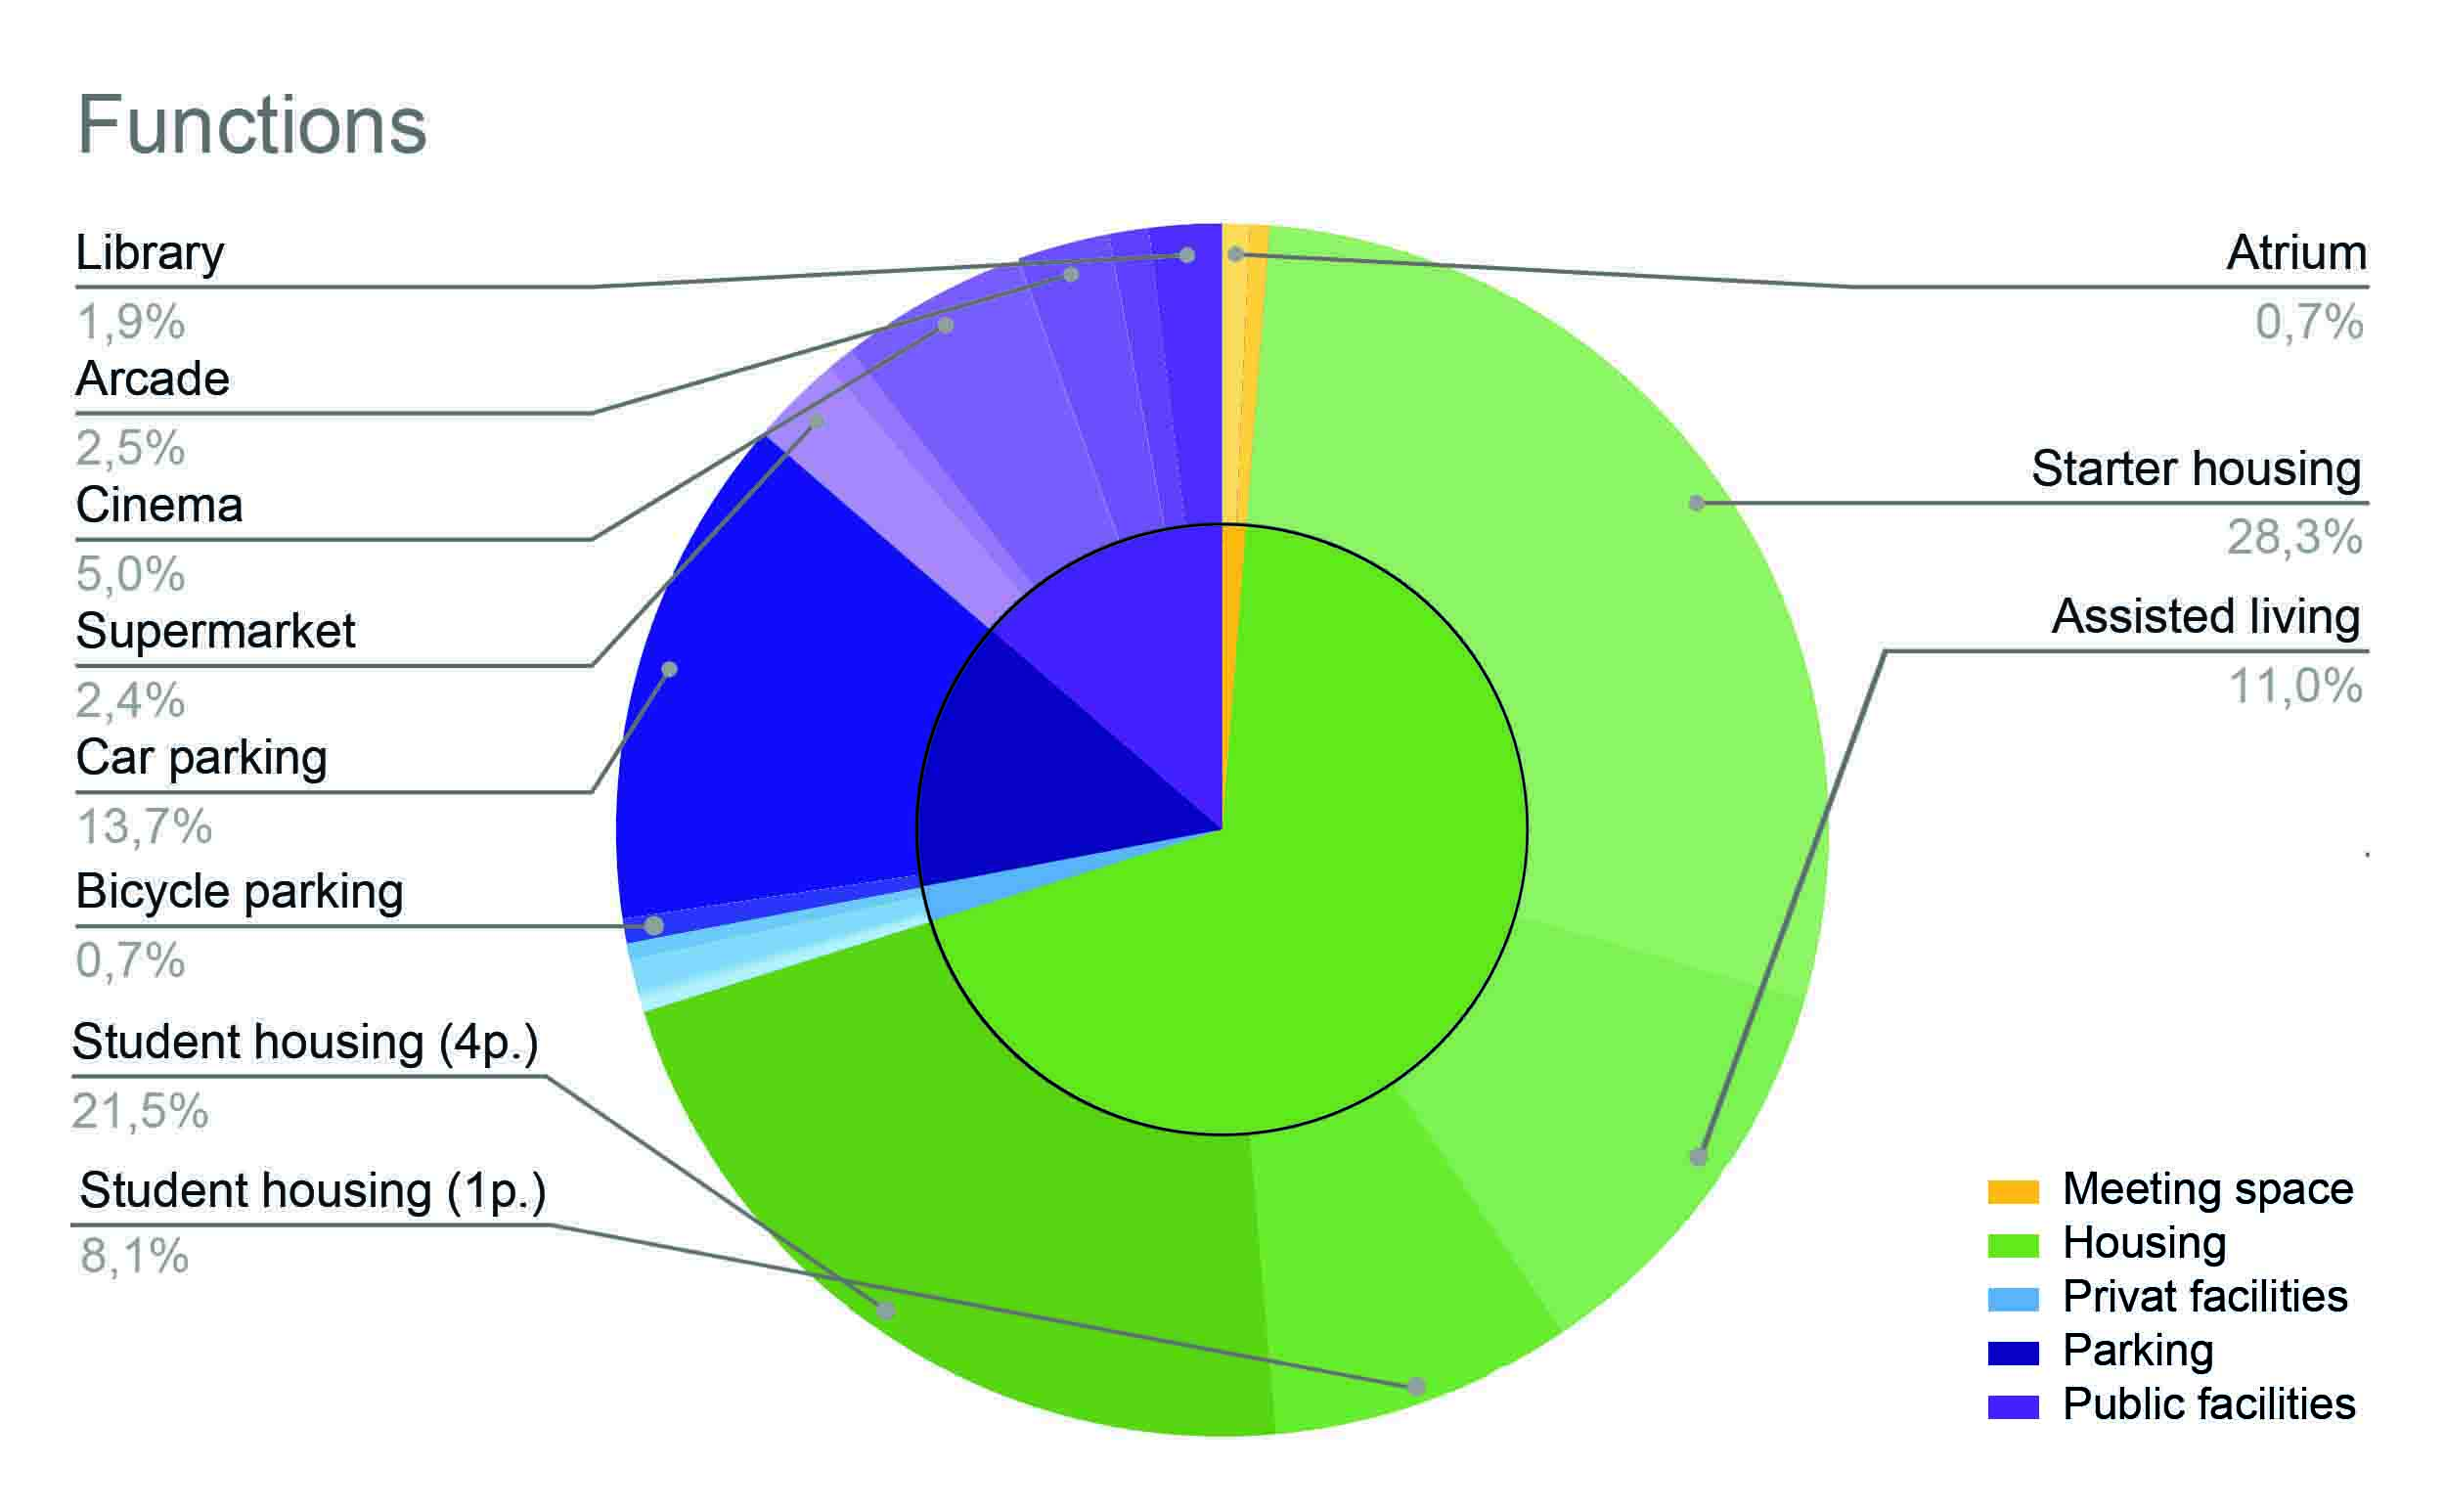
In addition to this, Figure 12 gives an overview of the percentage distribution of the different functions. The inside of the ring represents the total amount of space which is required for the overarching functions: Meeting space, housing, private facilities, public facilities and parking. The outside ring shows the specific facilities belonging to each overarching function.
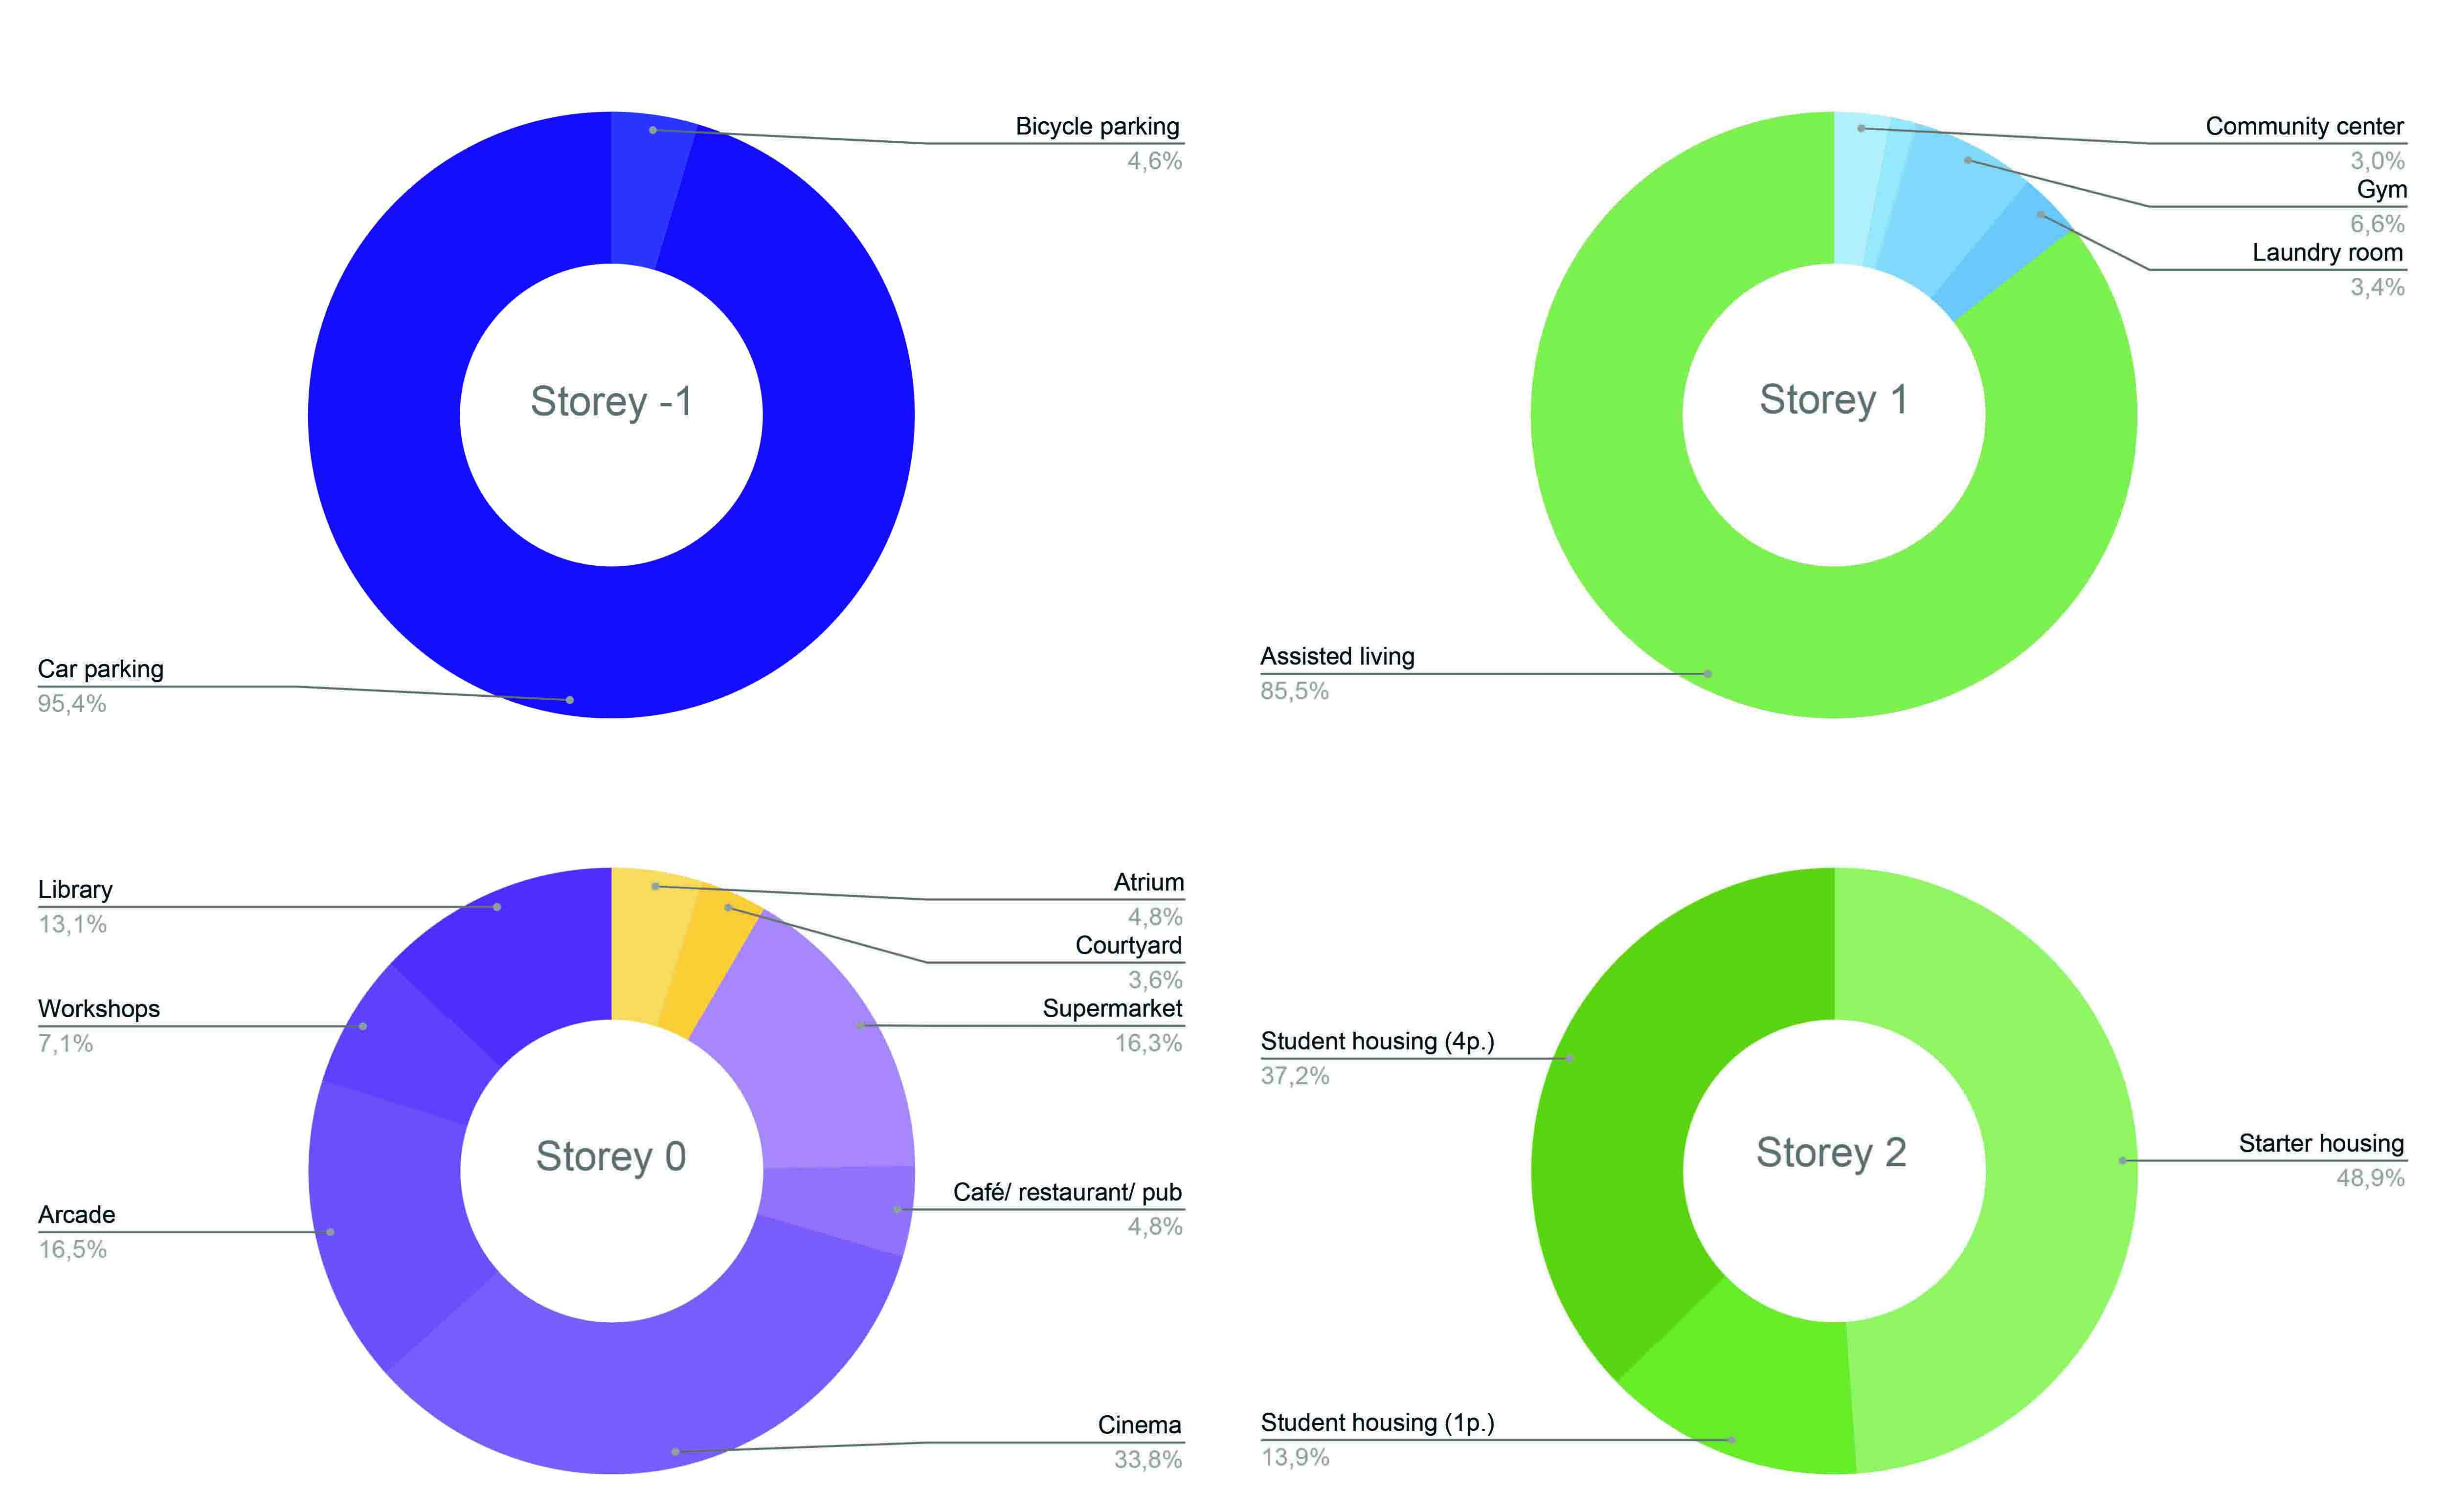
By assigning the subdivided facilities to different storey’s, as shown in Figure 13, we created our first possibility for locating each room. By mapping the facilities in a 3 dimensional way, we were able to see the grouping of the different kinds of spaces and thereby we could also see if our first attempt is possible. For example, all public facilities are located on the ground floor causing the possibility to make a seperate entrance for the residents of the building and their private facilities. You can also see that the assisted livings are located on the same floor as the private facilities in the hope that these people will use the facilities easier.
This is just the first attempt for a better overview, but further possibilities are not excluded and the mapping probably will change during the following design process.
Noise table
The average assigned noise level per space can be seen in Figure 14. As well as the hours in which the noise levels occur. The corresponding reason for the chosen time in which the noise levels score a middle to high level has also been added. Besides, the spaces that are noise sensitive have also been classified.
Noise chart
The previous table showed us the average noise level and sensitivity of the various rooms. To have a better impression when the functions reach the different noise levels in specific moments of the day, the following noise-diagram is made. This gives us a good overview of which functions can be located next to each other, and which ones have to be separated by a greater distance.