Products
Bubble diagram
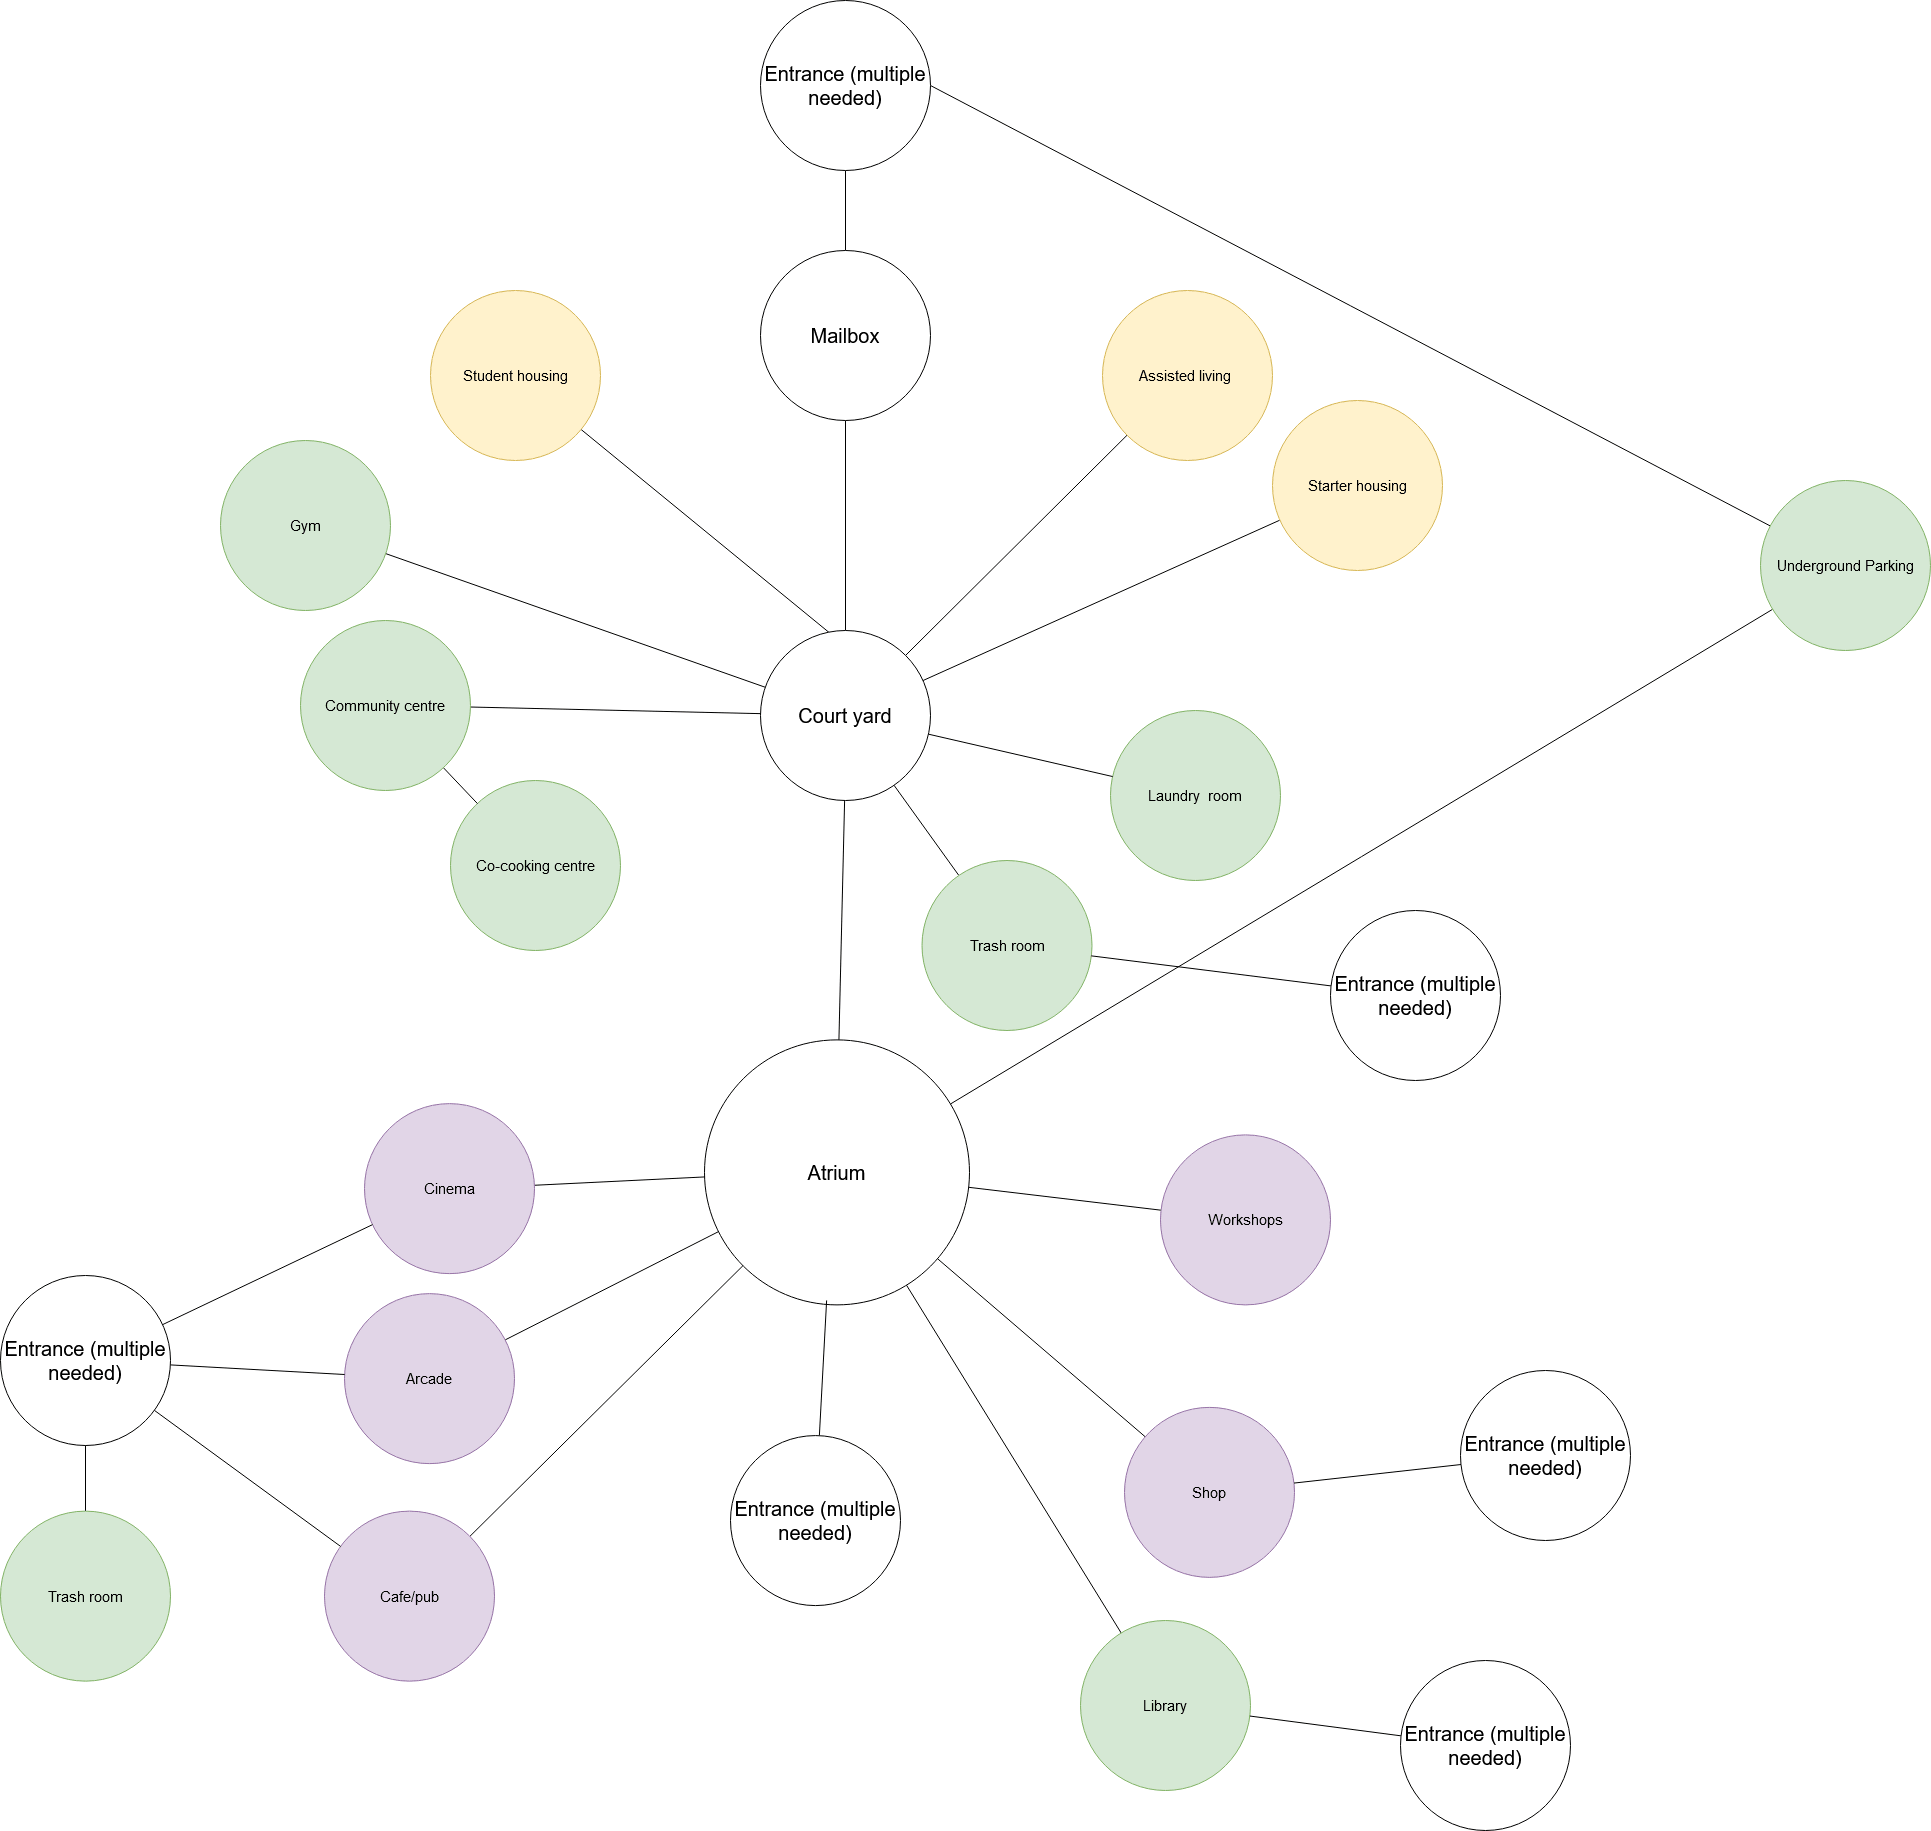
The bubble diagram in Figure 16 consists of four types of spaces: housing, centre, facilities and recreation. While the centre for public visitors is the atrium, in which all public spaces eventually lead to, the centre for the residents is the courtyard, this is where all the spaces that are only meant for residents are connected to. During the making of the bubble diagram, noise pollution is taken into account. The spaces that have been put on the left produce noise pollution and on the right side are noise sensitive functions. Furthermore, for the placement of the entrances the visuality, accessibility, and convenience have been considered.
Metronetwork
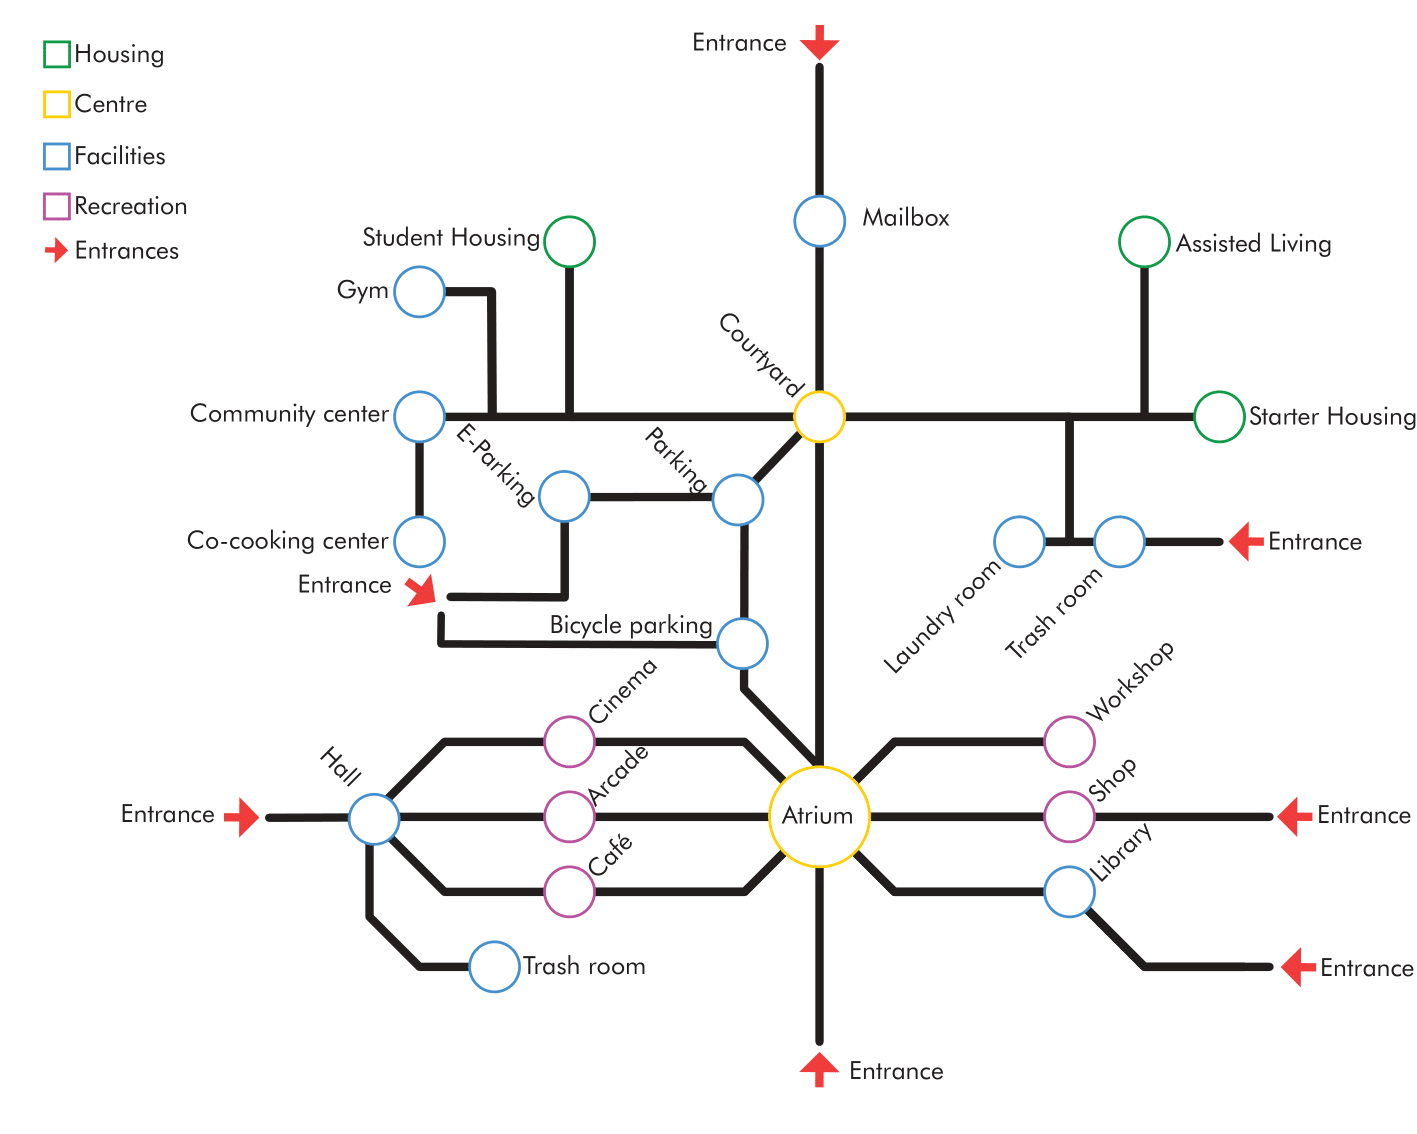
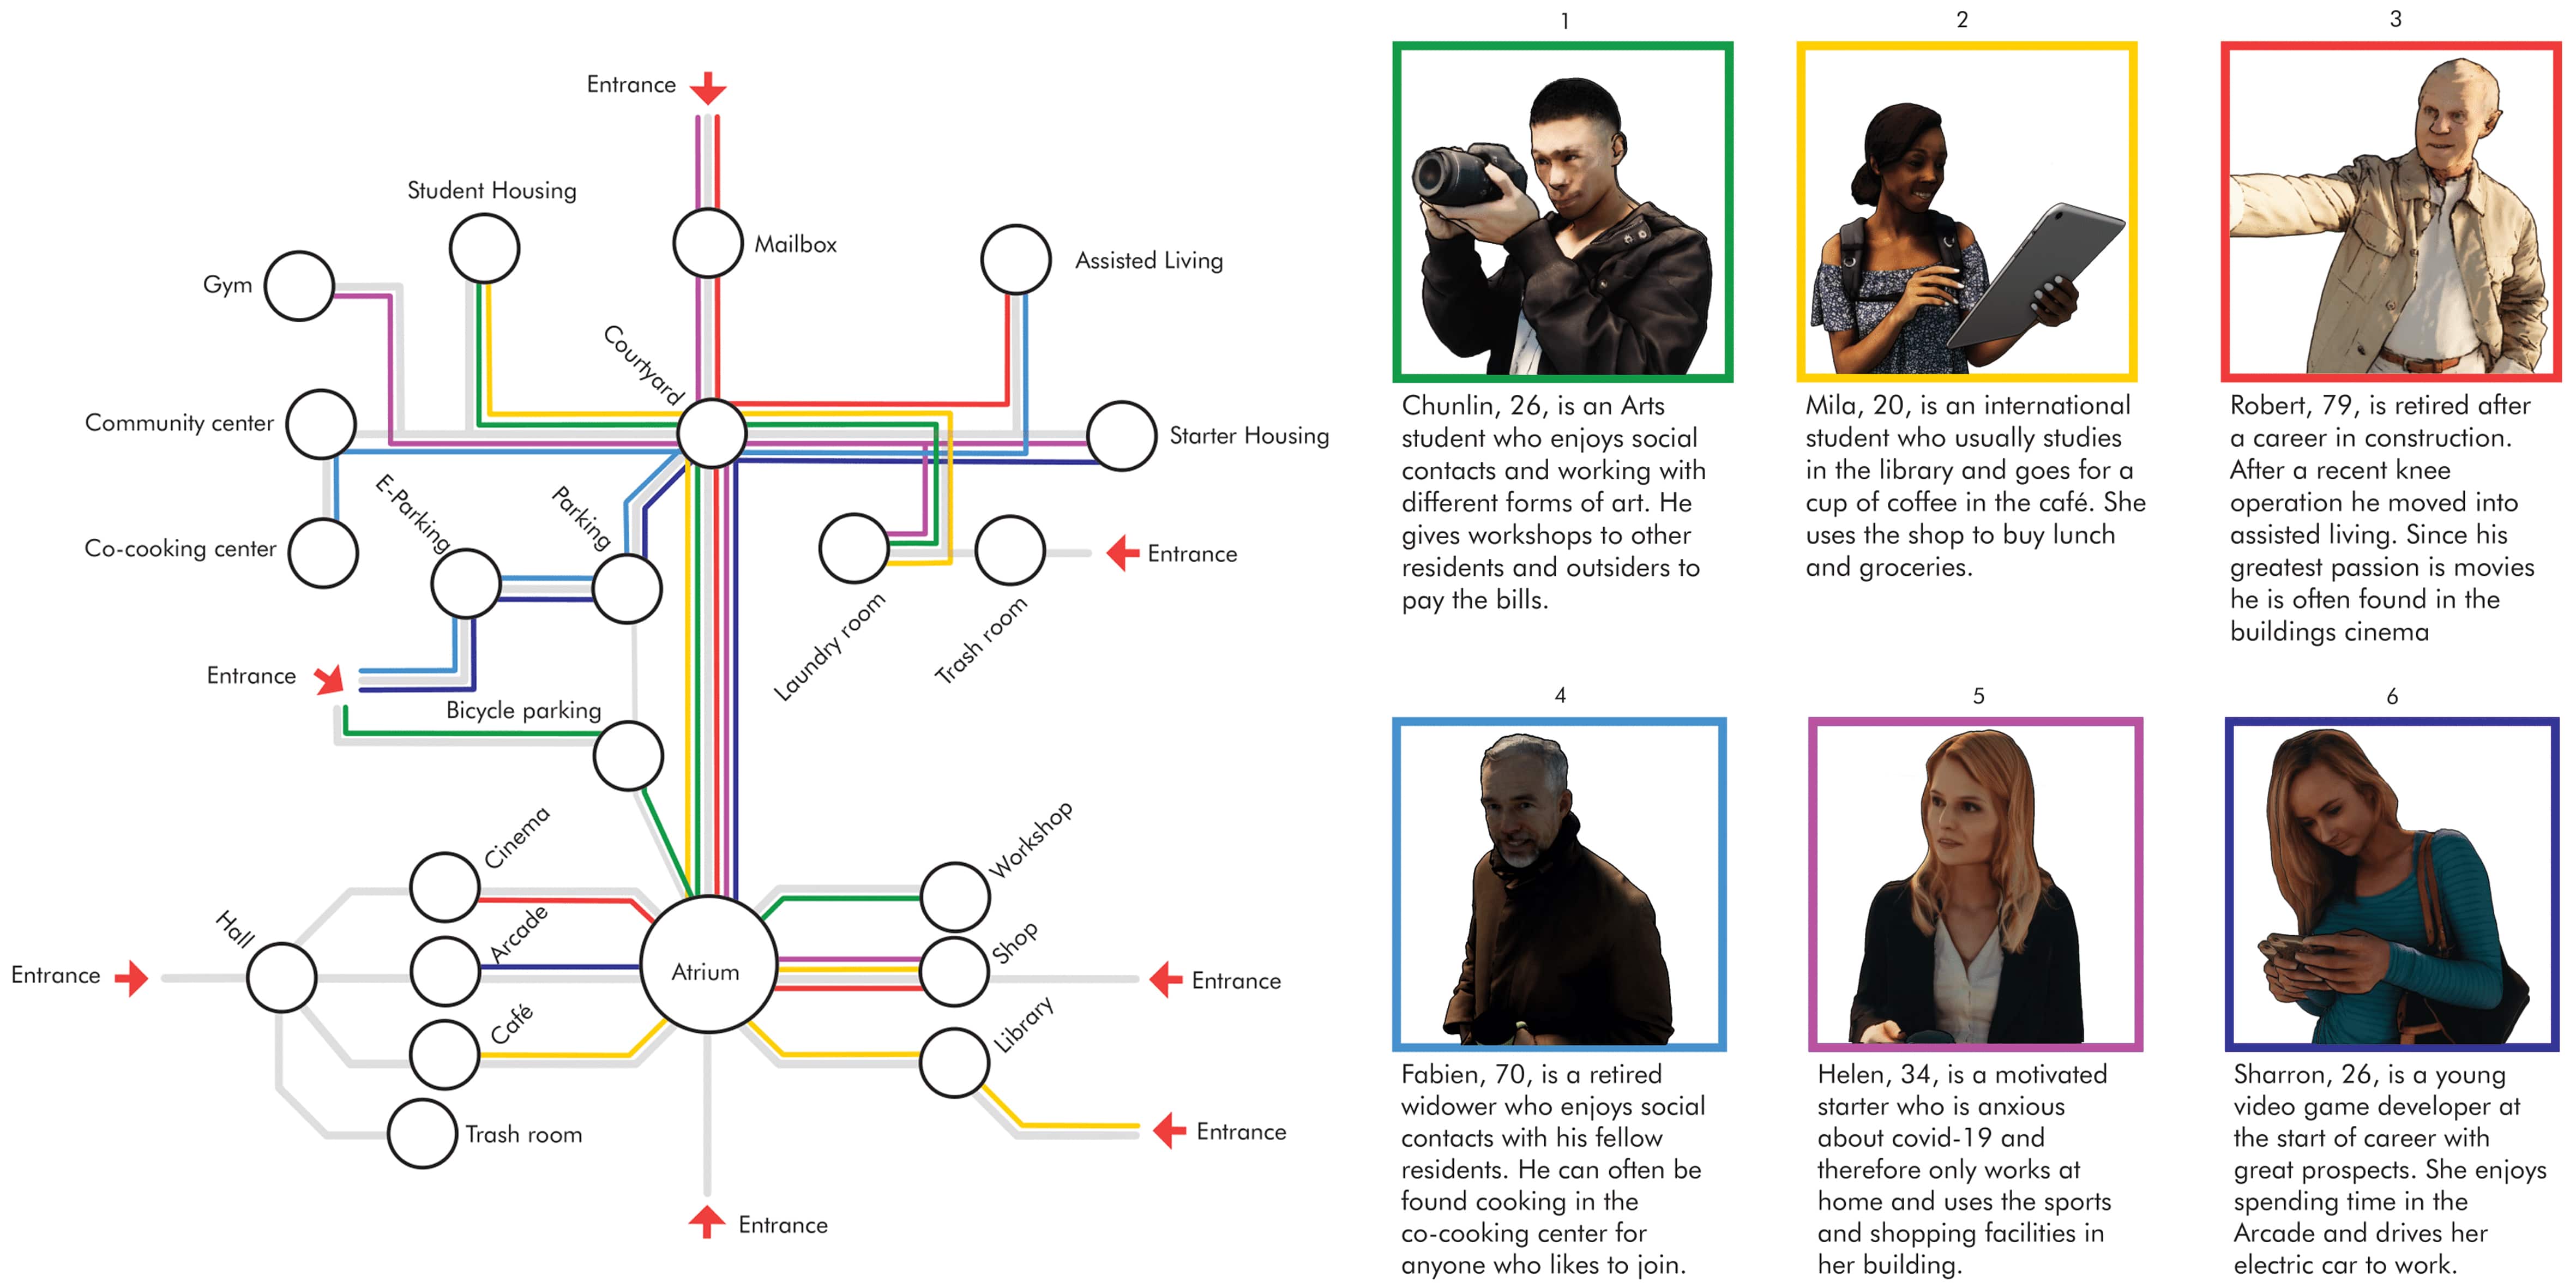
The Metro network in Figure 17 shows examples of the movement through the building of various residents. This graph gives us a first observation of how the connections in our bubble diagram could be used.
Resident stories
To test and optimise the metronetwork, we made up six imaginary stories to represent the future residents: two students, two starters and two elderly. In Figure 18 a day in the life of each resident is pictured.
Matrix
The matrix shows different kinds of abstract information which later will be used in the spatial computation of our site. The first part represents the connection between the different functions. As you can see, the matrix is not mirrored, this is due to a different kind of importance between the voxels. For example, is the connection between assisted living and starter housing more important (because the starters could help the residents of the assisted livings with small things) than the connection between starter housing and assisted living. In addition to the accessibility between the voxels, we added factors of graph-distance (like accessibility to the entrances and greenery), factors belonging to the euclidean-distance (silent level and noise sensitivity), and elements which can be categorized as ‘visibility’ such as daylight, direct sunlight and view.
Fundamental flowchart
The fundamental flowchart explains the creation of ZOHO’s pearl on a big scale. The flowchart consists of 4 sections, each section represents a certain process. This structure is also the common thread through the website. The first section is all about the making of the voxelated envelope (Notebook 1 using the sun analysis (Notebook 2. Furthermore, the second section will explain the usage of the Roof access (Notebook 4) and sound (Notebook 5) to optimize the location of the functions in the building. Subsequently the green section is about how all the collected data will let the model grow (Notebook 6 - 10). And in the last section the making of the shafts and corridors (Notebook 12) will be discussed, whereby the growing model and the circulation space will be combined and will lead to the creation of ZOHO’s pearl.
